


How the LinkedIn engagement rate is calculated
Your LinkedIn engagement rate is the total of reactions, comments and reposts on a post, divided by the impressions that post received, multiplied by 100.
That one line covers the standard method. What changes the result is which denominator you use, and what that denominator hides.
Engagement rate = (reactions + comments + reposts) / impressions x 100
Some people add clicks to the numerator. That is a valid variant, as long as you stay consistent. A rate calculated with clicks one month and without them the next tells you nothing about your progress.
Here is a complete worked example. A post collects 240 reactions, 38 comments, 12 reposts, and it was served 9,400 impressions.
- Add the interactions together: 240 + 38 + 12 = 290.
- Divide that total by impressions: 290 / 9,400 = 0.0309.
- Multiply by 100 to get a percentage: the engagement rate is 3.09%.
The calculator above runs those three steps for you. The table below shows the three methods in use, and what each one quietly leaves out.
What is a good LinkedIn engagement rate in 2026?
Across the 219,456 posts we analyzed in 2026, the average LinkedIn engagement rate is 3.49%, so a post above that line is above average for the platform.
Most ranges published on this topic are estimates. The same brackets get copied from one page to the next with no sample behind them, which is why you keep seeing the same tidy numbers everywhere. We took a different route. Every figure below is a measured median from the Taplio LinkedIn Benchmark, which analyzes more than 60,000 LinkedIn posts every month. The full method sits in our study on LinkedIn engagement rate.
Read your own number against your bracket, not against the platform average:
- Above your bracket median, the post worked with the audience it reached.
- At the median with unusually high impressions, the post worked even better than it looks.
- Below the median with low impressions, the format or the hook is the problem, not the algorithm.
Engagement rate by content format
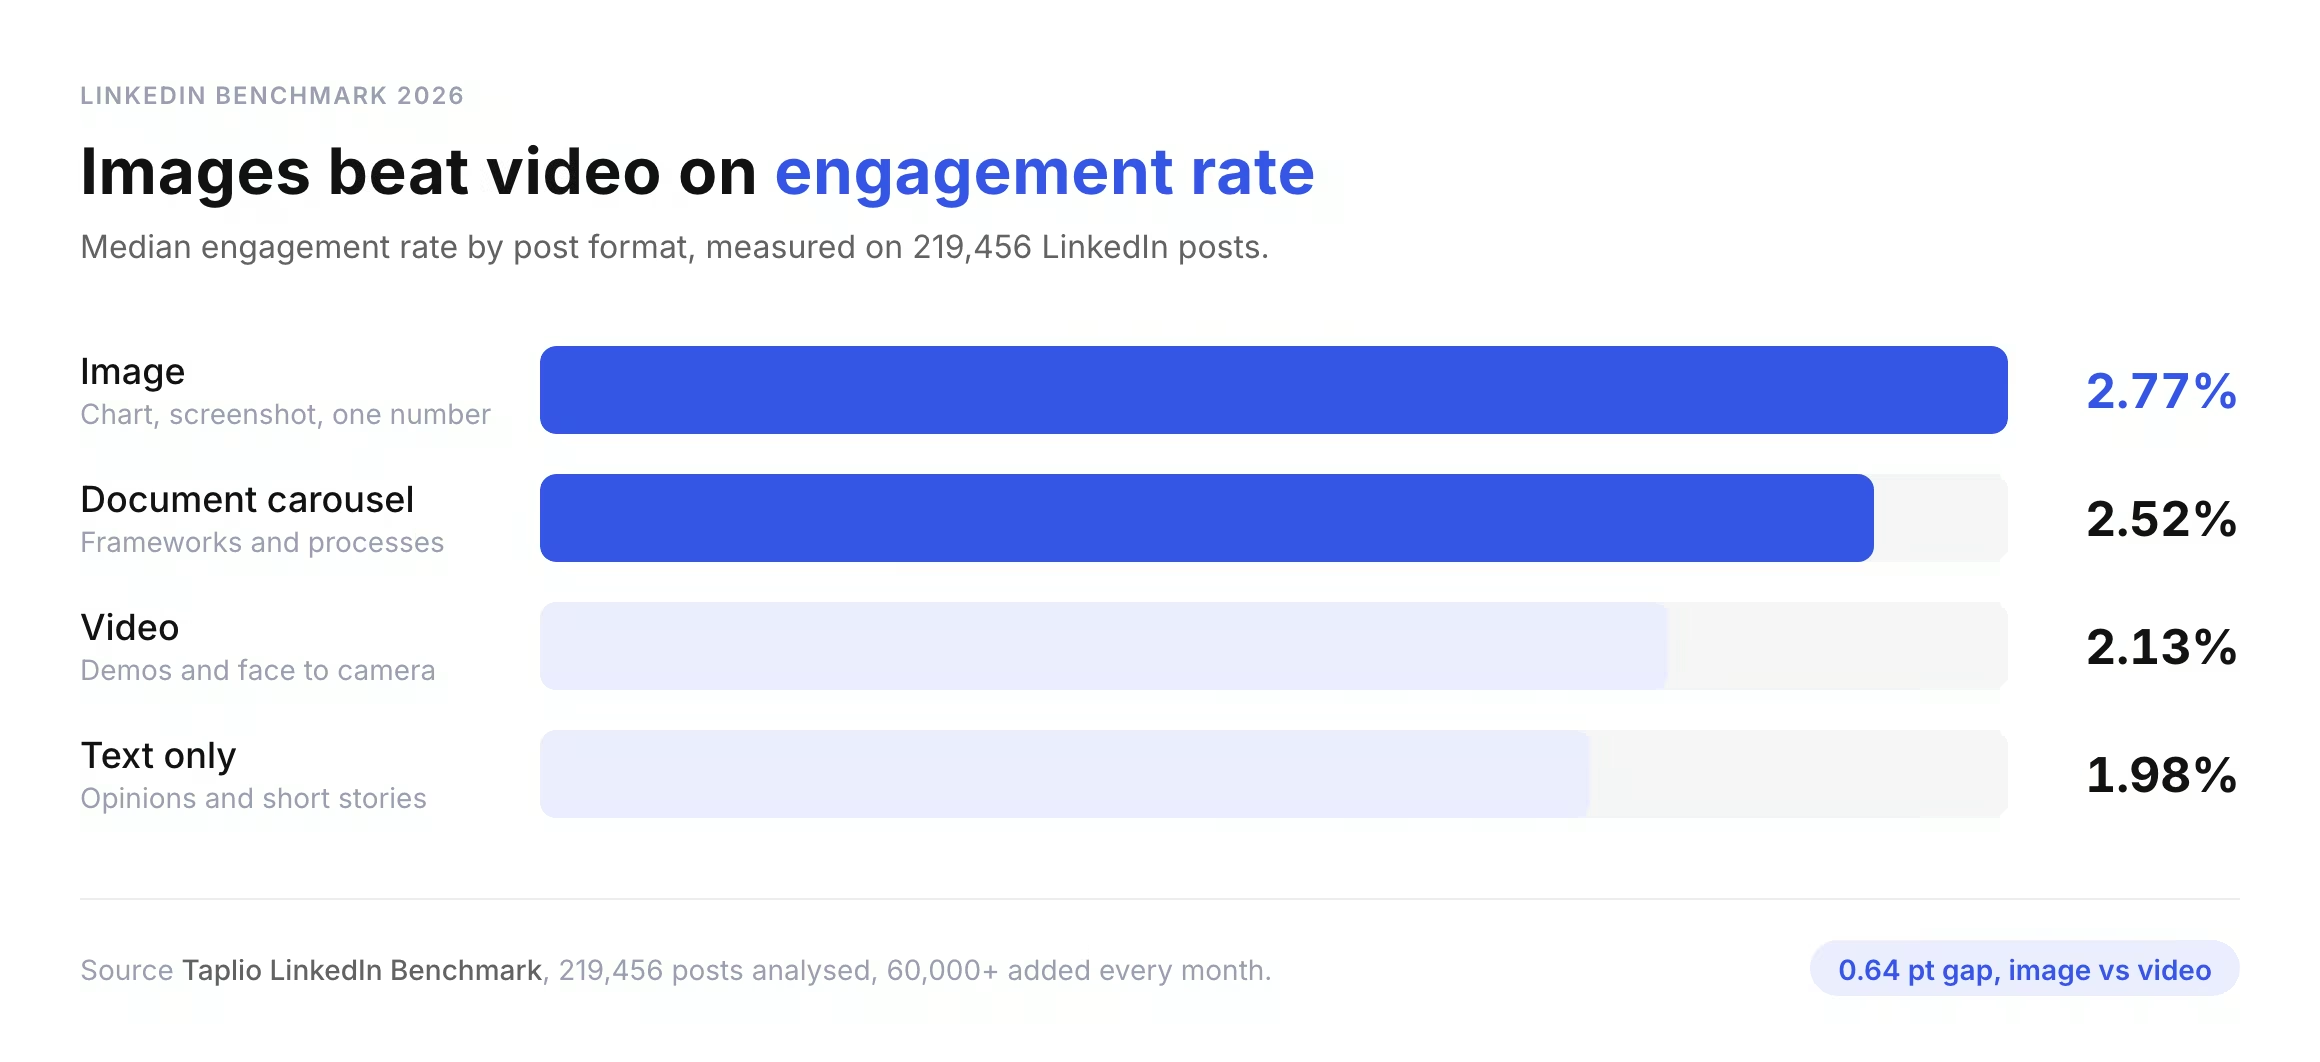
Images carry the highest median engagement rate of any LinkedIn format, ahead of video.
That order is counterintuitive. Video gets treated as the format the algorithm rewards, and it sits third. A plain image beats it by 0.64 points of median engagement rate. Before you invest in a video workflow, test the same idea as a single image.
Engagement rate by post length
Long posts beat short ones. Posts over 2,000 characters carry a median engagement rate of 2.56%, while posts of 0 to 200 characters sit at 1.53%. A one line post asks nothing of the reader, so it gets nothing back. Length is not the cause on its own, but the posts that earn attention almost always develop an idea rather than drop it.
Where to find your impressions, reactions, comments and reposts
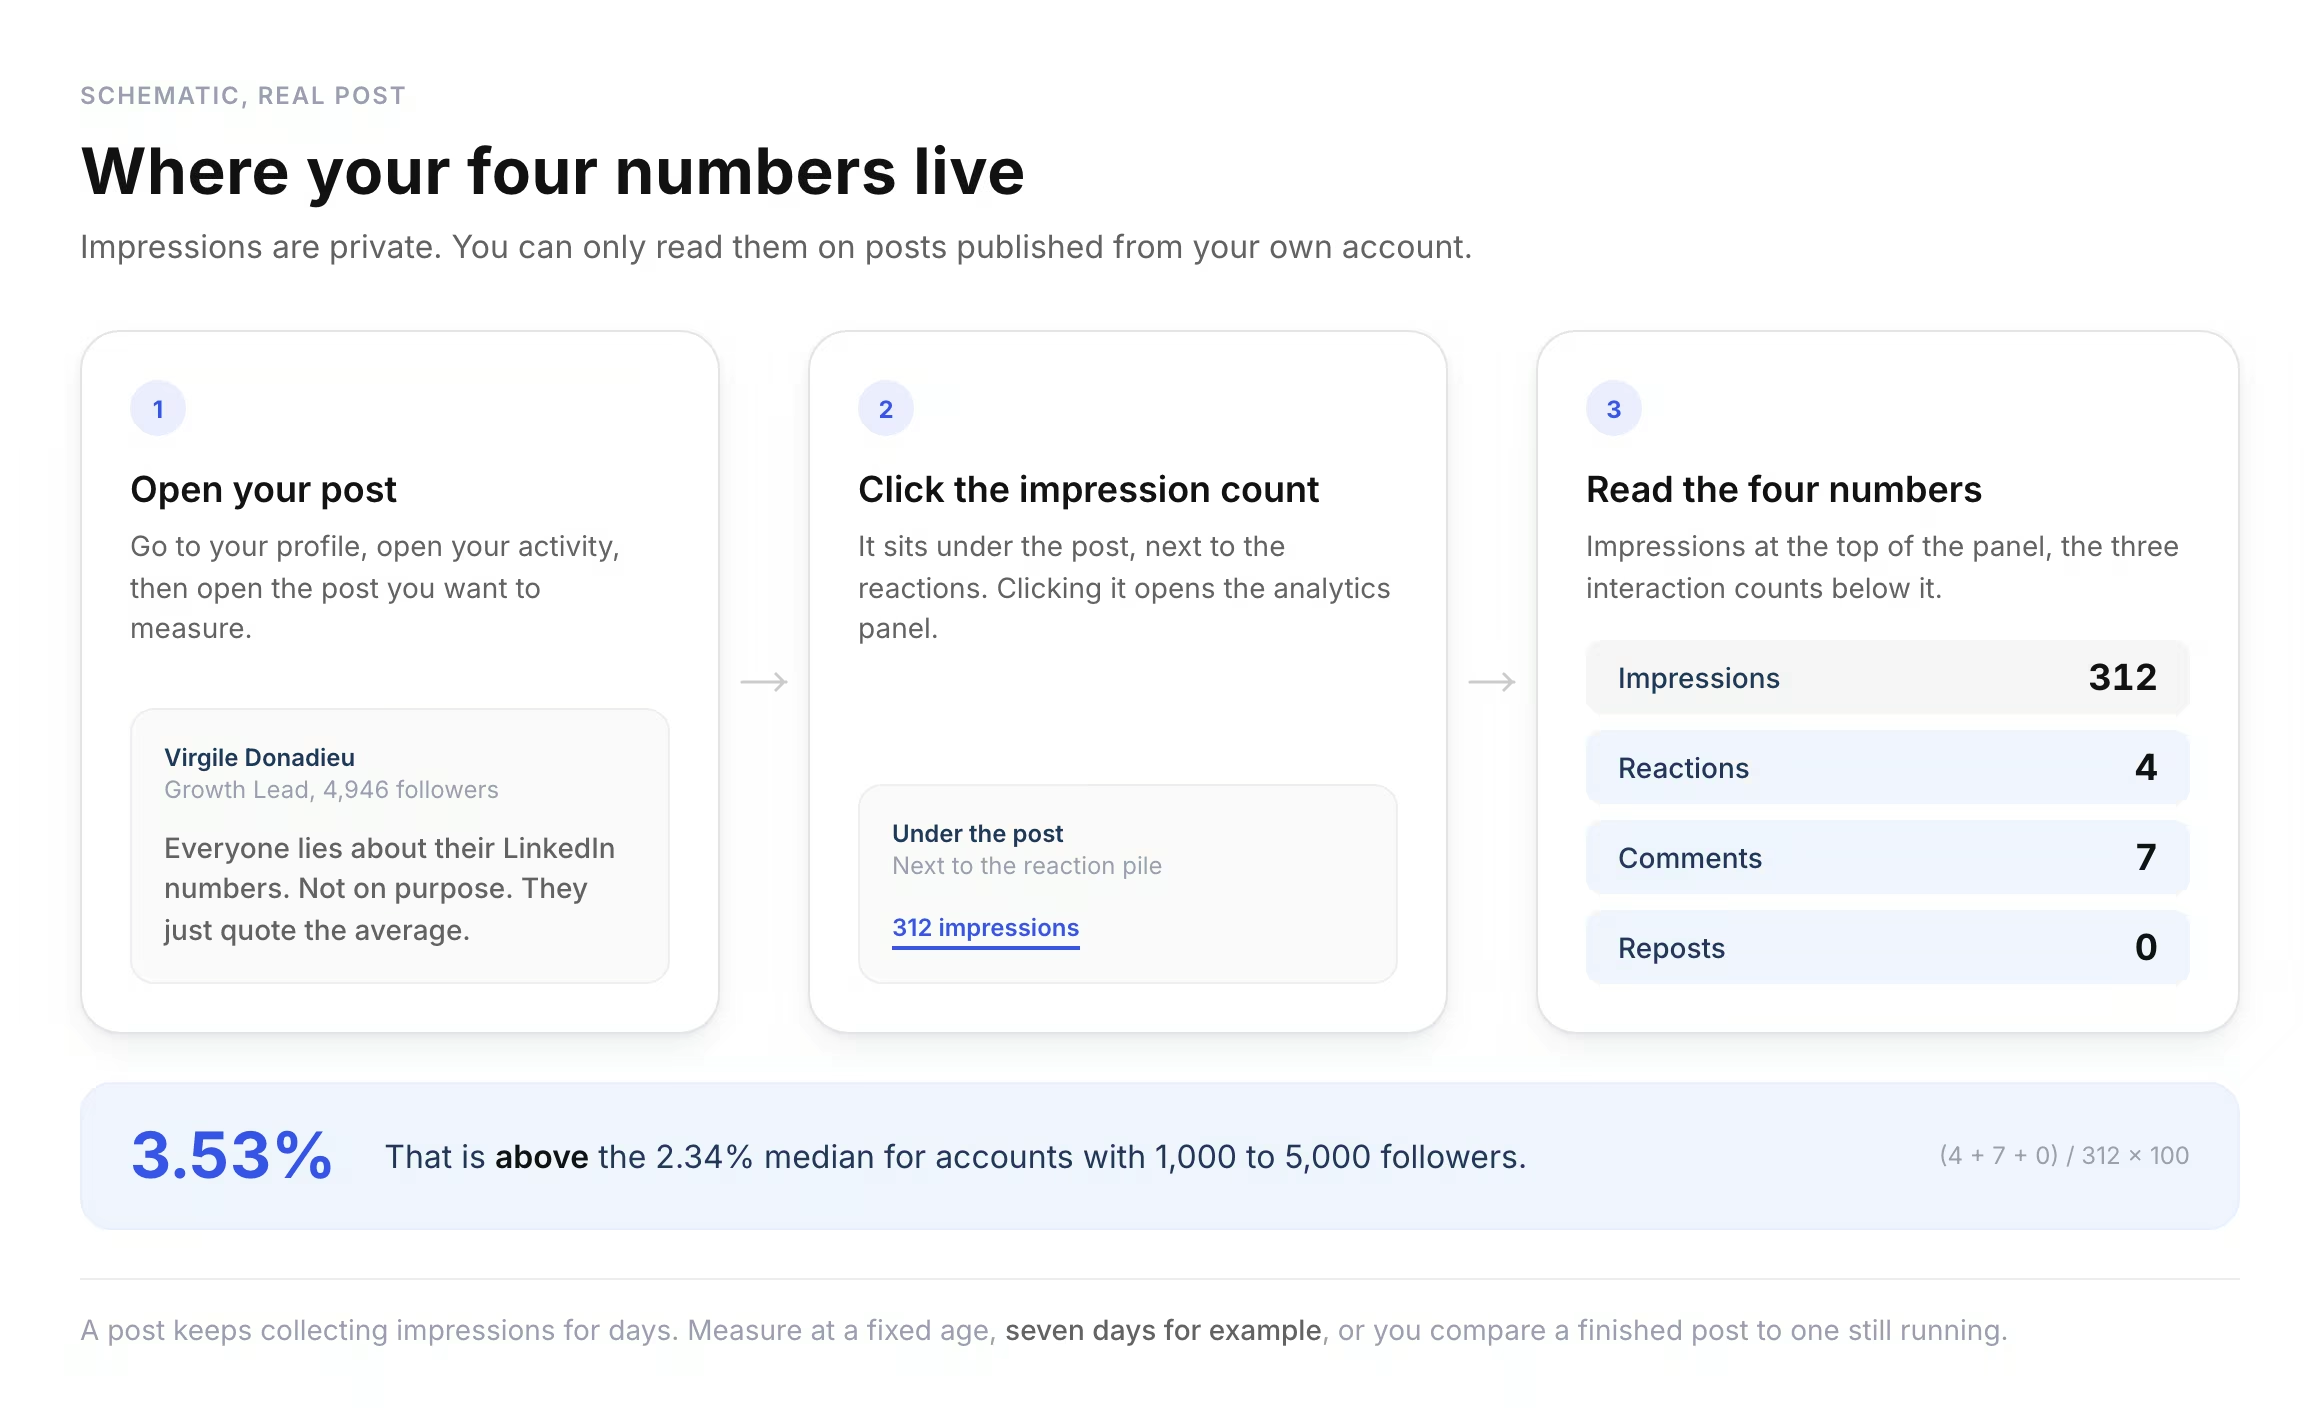
All four numbers sit in the analytics panel of the post itself, reachable in two clicks from your profile.
- Open your LinkedIn profile and scroll to the activity section.
- Click "Show all posts" to list everything you have published.
- Open the post you want to measure.
- Click the impression count displayed under the post, next to the reactions.
- Read impressions at the top of the panel, then reactions, comments and reposts below it.
- Enter the four numbers in the calculator at the top of this page.
For a company page, the path is different:
- Open the page as an admin and go to Analytics, then Content.
- Pick a date range, since page analytics report by period rather than by single post.
- Export the table if you want to calculate rates for several posts at once.
Two limits matter. Impressions are private: you can only see them on posts published from your own profile or from a page you administer, never on someone else's post. And the panel reports on a rolling window, so a post keeps accumulating impressions for days after publication. Measure at a fixed age, for example seven days, or you will compare a finished post to one still collecting reach.
Impressions or followers: which formula should you use?
Use impressions to judge a single post, and followers to compare one account with another.
- Impressions: the honest denominator for a post. It answers one question, what share of the people who actually saw this reacted to it.
- Followers: the stable denominator. It does not move with the algorithm, which is what makes it usable to compare two accounts or two months.
- Followers, when you have no choice: on any account that is not yours, impressions are hidden, so followers is the only denominator available.
- Both, on your best posts: a high impression rate with a low follower rate means the post traveled far outside your network. That is reach worth repeating.
Engagement rate vs reach vs impressions
Impressions count views, reach counts people, and engagement rate measures how efficiently those views turned into interactions.
Why engagement rate is an efficiency metric, not a success score
Engagement rate measures efficiency per view, not impact, so a high rate on a small post can be worth far less than a low rate on a large one.
Take two posts. One reaches 100,000 people at 1% and produces 1,000 interactions. The other reaches 100 people at 10% and produces 10. The second has a rate ten times better and did almost nothing. If you optimize for the ratio alone, you will end up rewarding posts that nobody saw.
There is also a mechanical trap. Rate falls as audience grows, because impressions scale faster than interactions. Our data shows it directly: 2.34% median in the 1,000 to 5,000 bracket against 1.66% above 50,000. A creator with 3,000 followers is not outperforming a creator with 80,000 by having a better rate. They are playing a different game with a smaller denominator. That is the whole reason we publish medians by bracket instead of one number for everyone.
The same logic explains why engagement pods are a dead end. A pod feeds a post reactions and comments from people who were going to see it anyway, which lifts the numerator and the rate without adding a single relevant reader. The chart improves. The pipeline does not.
How to improve your LinkedIn engagement rate
Change format and length first, since those are the two variables where our data shows the widest measured gaps.
Lead with an image, not a video
Images sit at a 2.77% median against 2.13% for video. Take the point you were going to film and turn it into one visual: a chart, a screenshot, a before and after.
Write past 2,000 characters
Posts over 2,000 characters reach a 2.56% median, against 1.53% for posts under 200. Develop the idea. Give the reader a reason to expand the "see more".
Use documents for anything with steps
Document carousels hold a 2.52% median, second only to images. Any framework, checklist or process belongs in that format rather than in a wall of text.
Reply to every comment
Replies keep a thread active, which extends the window during which LinkedIn keeps distributing the post. Answer with a real sentence, not an emoji, so the reply reads as content.
Compare yourself to your bracket, not to the feed
Your target is the median for your follower range, not the 3.49% platform average. Our LinkedIn analytics tool plots your posts against that reference so you can see which ones actually beat it.
Cut the posts that dilute
Posting more often does not lift a rate. If a topic consistently lands below your own median, drop it and put the slot toward a topic that clears it.
Track your engagement rate automatically
Taplio calculates the rate for every post you publish, so you never open a calculator again.
- The engagement rate of every post, computed from your own impressions.
- Where that post lands against the benchmark median for your follower bracket.
- The full history, so you can tell a better month from a louder one.
Start tracking your LinkedIn engagement rate with Taplio.
Frequently asked questions
The questions below cover the formula, the benchmarks and the small mechanics that change your result.
How do I calculate my LinkedIn engagement rate?
Add your reactions, comments and reposts, divide the total by the impressions the post received, then multiply by 100. Open the post, click the impression count under it to open analytics, and read the four numbers there. The calculator at the top of this page does the arithmetic and returns the percentage instantly.
Is 5% engagement rate on LinkedIn good?
Yes. 5% sits well above the 3.49% average we measured across 219,456 posts in 2026. It is strong at any account size, and excellent above 50,000 followers, where the median drops to 1.66%. Check the impression count before celebrating, because a very small audience inflates the percentage.
What is the 4-1-1 rule on LinkedIn?
The 4-1-1 rule is a posting mix. For every four pieces of content you share from other people, you publish one soft promotional post and one hard promotional post. It exists to keep a feed useful rather than salesy. It is a content ratio, not a metric, so it never appears in the engagement rate formula.
Is 2.5% engagement rate good?
Yes, for most accounts. 2.5% is below the 3.49% platform average but above the 2.34% median we measured for accounts with 1,000 to 5,000 followers, and well above the 1.66% median at 50,000 followers and up. Compare it to your own bracket, not to the platform average.
Where do I find my LinkedIn post impressions?
On the post itself. Open your profile, go to your activity, open the post, then click the impression count displayed under it. LinkedIn only shows impressions on posts published from your own account or from a page you administer. You cannot see impressions on anyone else's post.
Should I calculate engagement by impressions or by followers?
By impressions when you judge a post, by followers when you compare accounts. Impressions tell you what share of the people who actually saw the post responded to it. Followers give a denominator that does not move with the algorithm, which is what makes account to account comparison possible at all.
Does LinkedIn count my own likes and comments?
Yes. Your own reaction on your post and your replies to commenters are included in the totals LinkedIn displays. If you answer every comment, part of your engagement rate is your own activity. Subtract your replies when you want a clean read on how the audience alone responded.
How often should I check my engagement rate?
Weekly at the post level, monthly at the account level. A single post swings with topic, timing and luck, so one weak rate means nothing. Look at your last ten posts as a set instead. Once a month, compare your median against your follower bracket to see whether the trend is real.